
Option Payoff Diagrams Explained
Numbers tell you what happened. Pictures show you what could happen next. Option payoff diagrams turn complex outcomes into simple visual stories, making it easy to see exactly where you win, where you break even, and where you lose.
TL;DR
- Payoff diagrams visualize profit and loss: They show every possible outcome at expiration based on stock price movement
- X-axis = stock price, Y-axis = profit/loss: Each point on the chart shows your gain or loss at that stock price
- Long calls slope up, long puts slope down: The shape instantly reveals the risk/reward profile
- Break-even points are where lines cross zero: These critical prices show where you start making or losing money
- Value investors use diagrams to avoid emotional decisions: Visual clarity prevents panic trades and reinforces discipline
Why Diagrams Matter for Value Investors
Most investors trade options blind, chasing premiums without understanding the full picture. Value investors think differently. They need to see the complete range of outcomes before risking a single dollar.
A payoff diagram gives you that x-ray vision. It maps every scenario from "stock crashes 50%" to "stock doubles overnight." At a glance, you know your maximum gain, maximum loss, and the price points where your strategy shifts from winning to losing.
This matters because options aren't stocks. A stock position has unlimited upside and known downside (you lose 100% if it goes to zero). Options create custom risk profiles, capping gains in some cases, limiting losses in others. Without a diagram, you're guessing. With one, you're planning.
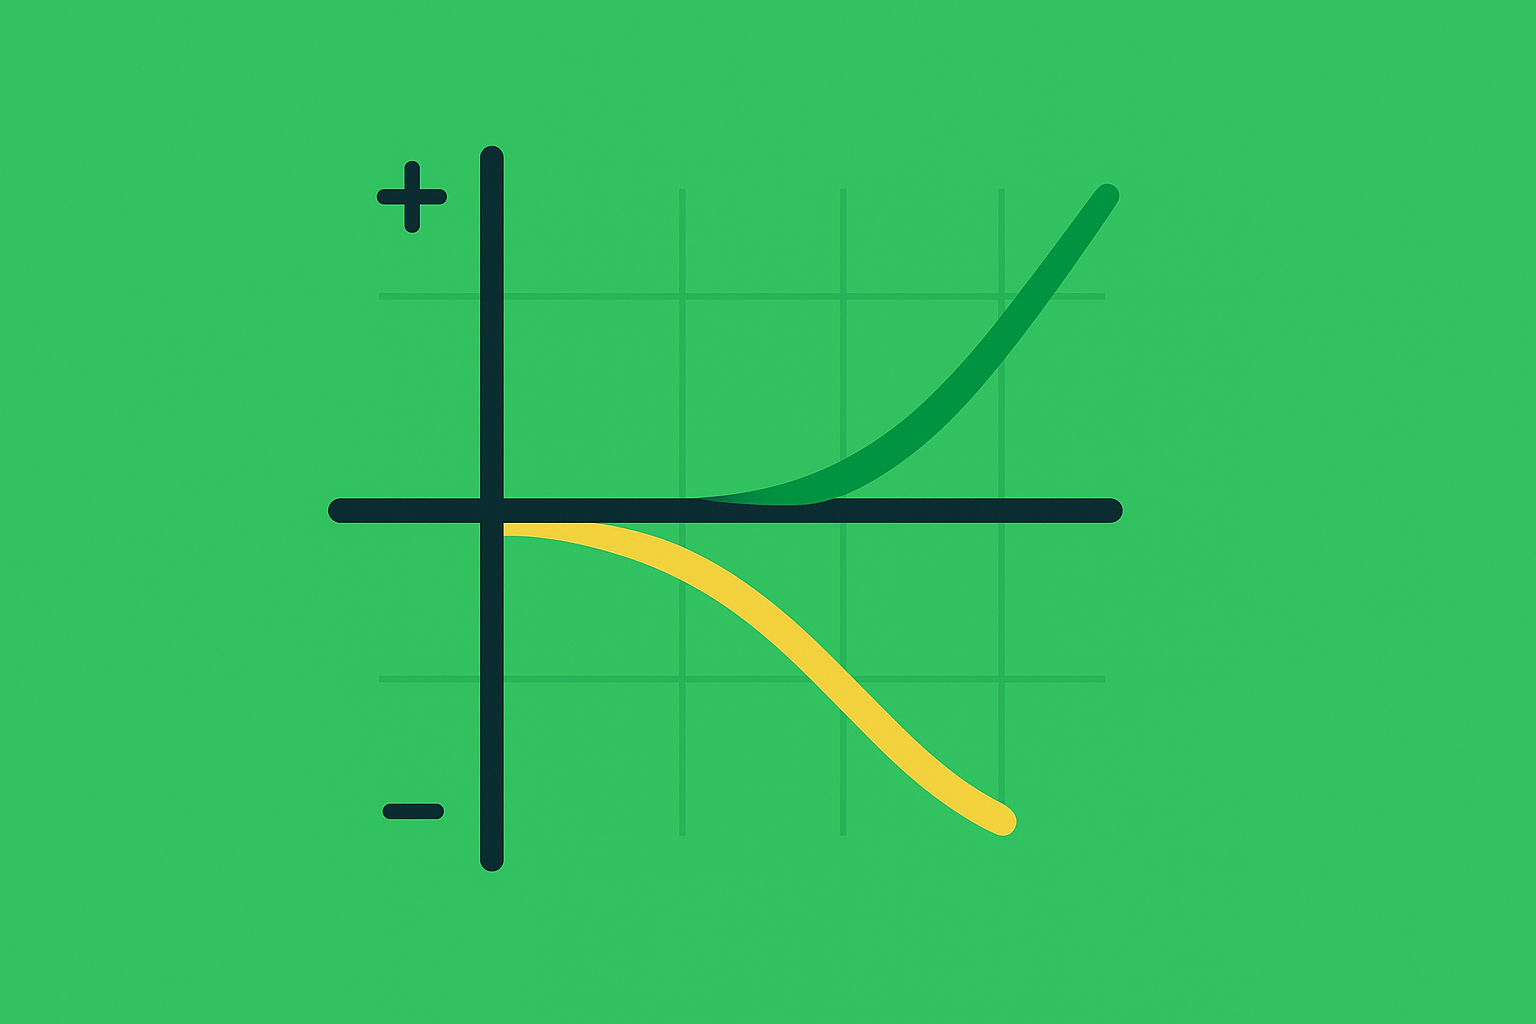
The Anatomy of a Payoff Diagram
Every diagram follows the same structure. The horizontal axis (X-axis) shows the stock price at expiration. The vertical axis (Y-axis) shows your profit or loss at that price. A line connects all the dots, creating your payoff curve.
Let's break down what you see:
Break-even point: Where the line crosses the zero profit line. Above this price, you make money. Below it, you lose.
Maximum profit zone: The highest point your line can reach. Some strategies have unlimited profit potential (the line keeps climbing). Others cap out at a specific dollar amount.
Maximum loss zone: The lowest point your line can reach. Long options have limited loss (you can only lose the premium paid). Short options can have unlimited loss if unprotected.
Slope direction: Steep lines mean leverage. Flat lines mean capped outcomes. A line pointing up-right means you profit when the stock rises. Down-right means you profit when it falls.
Long Call Payoff Diagram
Imagine you buy a $50 call on a stock trading at $48, paying a $2 premium. Your break-even is $52 (strike + premium). Below $50, the call expires worthless, you lose $200 (100 shares × $2 premium). At $52, you break even. Above $52, every dollar the stock climbs adds $100 to your profit.
The diagram shows a flat line at -$200 from zero to $50 (maximum loss zone). At $50, the line starts climbing at a 45-degree angle. It crosses zero at $52 (break-even), then continues rising forever (unlimited profit potential).
This visual instantly tells you three things: Your risk is limited to $200. You need the stock to rise 8% just to break even. If the stock takes off, your upside is uncapped.
Long Put Payoff Diagram
Now flip the script. You buy a $50 put on the same stock, paying $2 premium. Your break-even is $48 (strike minus premium). Above $50, the put expires worthless, you lose $200. At $48, you break even. Below $48, every dollar the stock falls adds $100 to your profit, down to zero stock price.
The diagram shows a flat line at -$200 from $50 to infinity (maximum loss zone). Below $50, the line slopes down-left. It crosses zero at $48 (break-even), then continues dropping until the stock hits zero (maximum profit = $4,800 if the stock goes to zero).
This reveals a key truth: buying puts has limited risk ($200), limited profit ($4,800 max), and requires the stock to fall 4% just to break even.
Selling Options Flips the Diagram
When you sell a call or put, the diagram mirrors upside-down. The maximum profit becomes your premium collected. The maximum loss becomes what the buyer's maximum profit was.
Short call example: You sell a $50 call for $2 premium. Your diagram shows +$200 flat profit above $52, then a line dropping down-left forever below $52. Your risk is now unlimited. Your reward is capped at $200.
Short put example: You sell a $50 put for $2 premium. Your diagram shows +$200 flat profit below $48, then a line dropping down-right as the stock falls. Your maximum loss is $4,800 (if stock goes to zero minus your $200 premium).
Value investors who sell puts use cash-secured put strategies to limit risk by holding cash to buy the stock if assigned.
Combining Strategies Creates New Shapes
Payoff diagrams get powerful when you layer multiple positions. A covered call combines stock ownership (diagonal line up-right) with a short call (capped profit). The resulting diagram shows profit rising until the strike price, then flattening out.
A protective put combines stock ownership with a long put. The diagram shows unlimited upside from the stock, but the downside gets cut off at the put strike, creating a "floor" below which you can't lose.
These visual combinations help you design strategies that match your risk tolerance and market view. Instead of guessing, you engineer outcomes.
What Could Go Wrong?
Diagrams assume you hold until expiration: If you exit early, the actual profit/loss won't match the diagram. Time decay and volatility changes create different outcomes mid-trade.
Diagrams ignore transaction costs: Commissions, spreads, and assignment fees reduce your actual profit. Factor in at least $1-2 per contract in total costs.
Diagrams don't show probability: A line showing unlimited profit doesn't mean it's likely. A stock doubling is rare. Diagrams show "what if," not "how likely."
Diagrams can encourage overconfidence: Seeing a "limited loss" of $200 feels safe, but losing $200 repeatedly adds up. Limited risk per trade doesn't mean zero risk across a portfolio.
Diagrams don't account for early assignment: American-style options can be exercised anytime. Your diagram assumes you control the timing, but assignment can happen before expiration, especially on short positions.
Next Steps
- Draw payoff diagrams for every option trade before entering, comparing risk/reward to your valuation thesis
- Use free tools like OptionStrat or your broker's platform to generate diagrams automatically
- Practice sketching basic diagrams by hand to internalize the patterns (long call up-right, long put down-left, short positions flipped)
- Overlay your intrinsic value estimates on the X-axis to see where fair value sits relative to your break-even points
- Understand the mechanics of buying vs. selling options before deciding which side of the trade matches your goals
Payoff diagrams replace fear with clarity. They turn options from black boxes into transparent tools. Use them before every trade, and you'll never wonder "what happens if" again.
*Disclaimer: This content is for educational purposes only and does not constitute financial advice. Past performance does not guarantee future results. Always conduct your own research before investing.*