
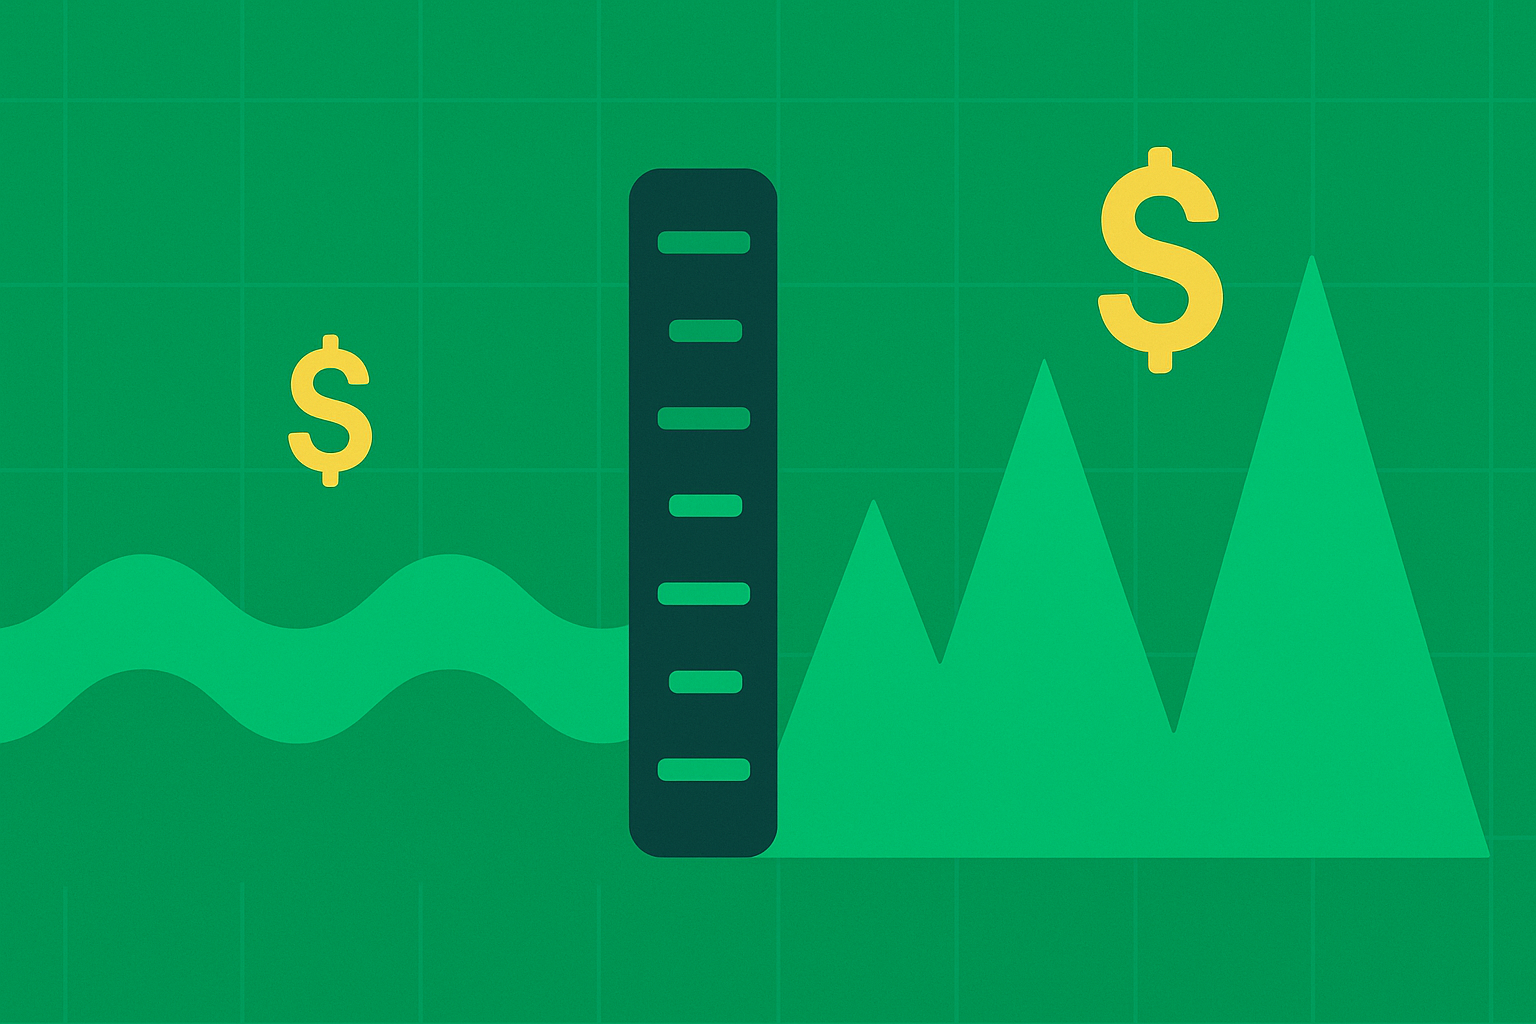
Understanding Implied Volatility
Two identical stocks, same price, same fundamentals. One pays you $150 to sell a covered call expiring in 30 days, the other pays $300. What's the difference? Implied volatility (IV). It's the market's fear gauge baked into every option price, and understanding it separates casual option traders from those who consistently profit. Master IV, and you'll know exactly when to sell options and when to walk away.
TL;DR
- Implied volatility (IV) = market's expectation of future price swings: Higher IV means higher option premiums, but also higher perceived risk
- IV changes constantly: Same stock can have 20% IV one month and 50% IV the next, dramatically affecting option prices
- High IV favors option sellers: When fear is high, premiums are fat, perfect time to sell covered calls and puts, on wonderful companies!
- Low IV favors patience: Skinny premiums mean waiting for better opportunities or buying protective puts cheaply, might not be enough return.
- IV rank and percentile matter more than raw numbers: A stock at 30% IV might be expensive or cheap depending on its history
What Implied Volatility Actually Is
Implied volatility is the market's guess about how much a stock will move over the next year, expressed as a percentage. It's "implied" because you can't see it directly, it's calculated backward from option prices using fancy math (Black-Scholes formula).
Think of IV like an insurance premium. When hurricanes are common, home insurance costs more. When weather is calm, insurance is cheap. Options work the same way. When the market expects big stock moves, IV rises and option premiums fatten. When things are calm, IV falls and premiums shrink.
Here's what it means in practice: a stock trading at $50 with 40% implied volatility is expected to stay within a range of $30 to $70 (roughly one standard deviation) over the next year. Higher IV means a wider expected range, lower IV means a tighter range.
The Math Made Simple
Let's compare the same stock in two IV environments:
Low IV scenario (20%):
- Stock price: $50
- Expected annual range: $40-60
- 30-day covered call premium (at-the-money): $80
- Monthly income rate: 1.6%
High IV scenario (50%):
- Stock price: $50
- Expected annual range: $25-75
- 30-day covered call premium (at-the-money): $220
- Monthly income rate: 4.4%
Same stock, same strike, same expiration. But high IV nearly triples your premium. That's the power of volatility.
Why This Matters for Value Investors
Value investors buy undervalued businesses and hold them patiently. During that holding period, implied volatility creates profit opportunities:
Market panics = income bonanzas: When the market freaks out (like March 2020 or October 2008), IV explodes. Suddenly, your stable value stocks pay 3-5% monthly premiums instead of 1-2%. These are the times to aggressively sell covered calls and cash-secured puts.
Quiet markets = buying protection: When IV is low, protective puts cost almost nothing. If you're worried about a concentrated position or market risk, low IV periods let you hedge cheaply.
IV expansion = mean reversion opportunity: If your stock normally trades at 25-35% IV but suddenly hits 60% after bad news, that's often temporary panic. Selling premium at inflated IV means you're getting paid for fear that will likely fade.
How to Read IV Numbers
Raw IV percentages don't tell the whole story. A biotech stock at 80% IV might be normal, while a utility at 30% IV is screaming high. You need context.
IV Rank: Shows where current IV sits relative to its 52-week range. Formula: (Current IV - 52-week low) ÷ (52-week high - 52-week low) × 100. An IV rank of 80 means current IV is in the 80th percentile of its annual range, very high.
IV Percentile: Similar concept, shows what percentage of the past year had lower IV than today. An IV percentile of 75 means current IV was higher than 75% of recent readings.
Both metrics answer the same question: is this stock's IV expensive or cheap relative to its own history?
Real Numbers in Action
Let's walk through a practical example using "Reliable Manufacturing," a stable value stock:
Normal environment:
- Stock: $45
- IV: 25% (IV rank: 40, middling)
- $48 call, 30 days: $95 premium
- Annualized income: ~25%
After market dip:
- Stock: $42 (down 7% on market weakness, not company news)
- IV: 45% (IV rank: 85, very high)
- $45 call, 30 days: $180 premium
- Annualized income: ~51%
Your stock dropped slightly, but IV jumped. This is the sweet spot. You can sell covered calls at strikes closer to current price for double the normal premium. Or sell cash-secured puts at attractive entry prices with fat premiums cushioning your downside.
When to Sell Options (High IV)
The best time to sell covered calls and cash-secured puts is when IV rank is above 50, ideally above 70. You're collecting premium inflated by fear and uncertainty.
Market-wide volatility spikes: When the VIX (market volatility index) jumps above 25-30, nearly all stocks show elevated IV. This is prime time for option income strategies across your portfolio.
Stock-specific news: Earnings announcements, FDA decisions, lawsuit news, these events spike IV temporarily. If you understand the business fundamentals and the stock is undervalued, selling options into high IV can be very profitable.
Economic uncertainty: Recession fears, interest rate volatility, geopolitical events. These create sustained high-IV environments where option premiums stay fat for weeks or months.
When to Avoid Selling (Low IV)
When IV rank drops below 30, especially below 20, premiums get skinny. You're working harder for less income, and the risk-reward tilts against you.
Calm markets: When VIX is under 15 and your stock's IV is in the bottom 25% of its range, consider waiting. The extra patience often pays off when volatility returns.
After volatility crashes: Post-earnings, after major announcements resolve, IV often collapses 50% or more overnight. Don't chase those falling premiums, wait for the next spike.
Exception: If you're building a position via cash-secured puts, low IV can still work because you're focused on buying undervalued stocks at good prices, and most any premium is a bonus, we like to get at least 20% for annual ROI.
IV and Different Strategies
Covered calls: Love high IV. Premiums are fat, and if assigned, you're selling at your target anyway. IV rank above 60 is ideal.
Cash-secured puts: Also love high IV. You collect inflated premiums while agreeing to buy at prices you already wanted. IV rank above 50 works well.
Protective puts: Prefer low IV. When hedging costs are minimal, you can insure concentrated positions or portfolio risk cheaply. Buy protection when IV rank is under 30.
LEAPs (long-term calls): Prefer low IV. If you're buying calls as stock substitutes, low IV means cheaper entry. But be careful, low IV often signals little expected movement, right now.
What Could Go Wrong?
Selling into artificially low IV: If your stock's IV is at 15% when its normal range is 25-40%, you're selling premium at fire-sale prices. Better to wait.
Mitigation: Always check IV rank before selling options. Set an alert for when IV rank crosses 50, that's your signal to review opportunities. Most brokers show IV rank on option chains.
Confusing high IV with good opportunity: Sometimes IV is high because real risk exists. A company facing bankruptcy might show 100% IV, but selling options is foolish.
Mitigation: Only trade options on wonderful companies you've thoroughly analyzed for intrinsic value. High IV is an opportunity only when combined with solid business fundamentals and undervaluation.
IV crush after earnings: Selling options right before earnings captures high IV, but if you're still holding after the announcement, IV collapses and your position loses value fast, even if the stock barely moved.
Mitigation: Close or roll positions before earnings if you don't want to hold through the announcement. Or only sell post-earnings when IV has already dropped, accepting lower premiums for more predictable outcomes.
Ignoring the VIX: Your stock might show 30% IV, but if the VIX is at 10, that's relatively expensive. If VIX is at 40, your stock is cheap.
Mitigation: Track both stock-specific IV metrics and overall market volatility (VIX). The best trades combine high stock IV rank AND elevated market volatility.
Next Steps: Mastering IV
- Check IV rank before every options trade: Make it a standard part of your process, never sell without knowing if IV is high or low
- Track the VIX: Follow the market volatility index to gauge overall option premium environment
- Build IV watchlists: Identify 10-15 value stocks and monitor their IV rank weekly
- Set IV rank alerts: Configure alerts for when stocks cross IV rank 60 (good selling) or drop below 30 (pause selling)
- Study historical IV patterns: Chart a stock's IV over 2-3 years to see its normal range and spike patterns
- Learn IV percentile: Many platforms show both rank and percentile, use whichever is clearer to you
- Understand earnings IV crush: Watch how dramatically IV falls after announcements to time entries better
- Connect IV to time decay: High IV means fat time premium, which decays faster, use theta strategies when IV is elevated
Implied volatility is the pricing engine behind options. When you understand IV, you know when option premiums are cheap, expensive, or just right. You stop blindly selling calls every month and start targeting high-IV windows where your edge is maximized.
The beauty of IV is that it cycles. Markets calm down, then panic, then calm again. Patient value investors can sit tight during low-IV periods and then strike aggressively when volatility spikes. This disciplined approach turns option income from a side hustle into a systematic strategy. Keep the riddim steady, wait for high IV, and collect inflated premiums on wonderful businesses trading below intrinsic value.
*Disclaimer: This content is for educational purposes only and does not constitute financial advice. Past performance does not guarantee future results. Always conduct your own research before investing.*