
Risk Management and Position Sizing Tools
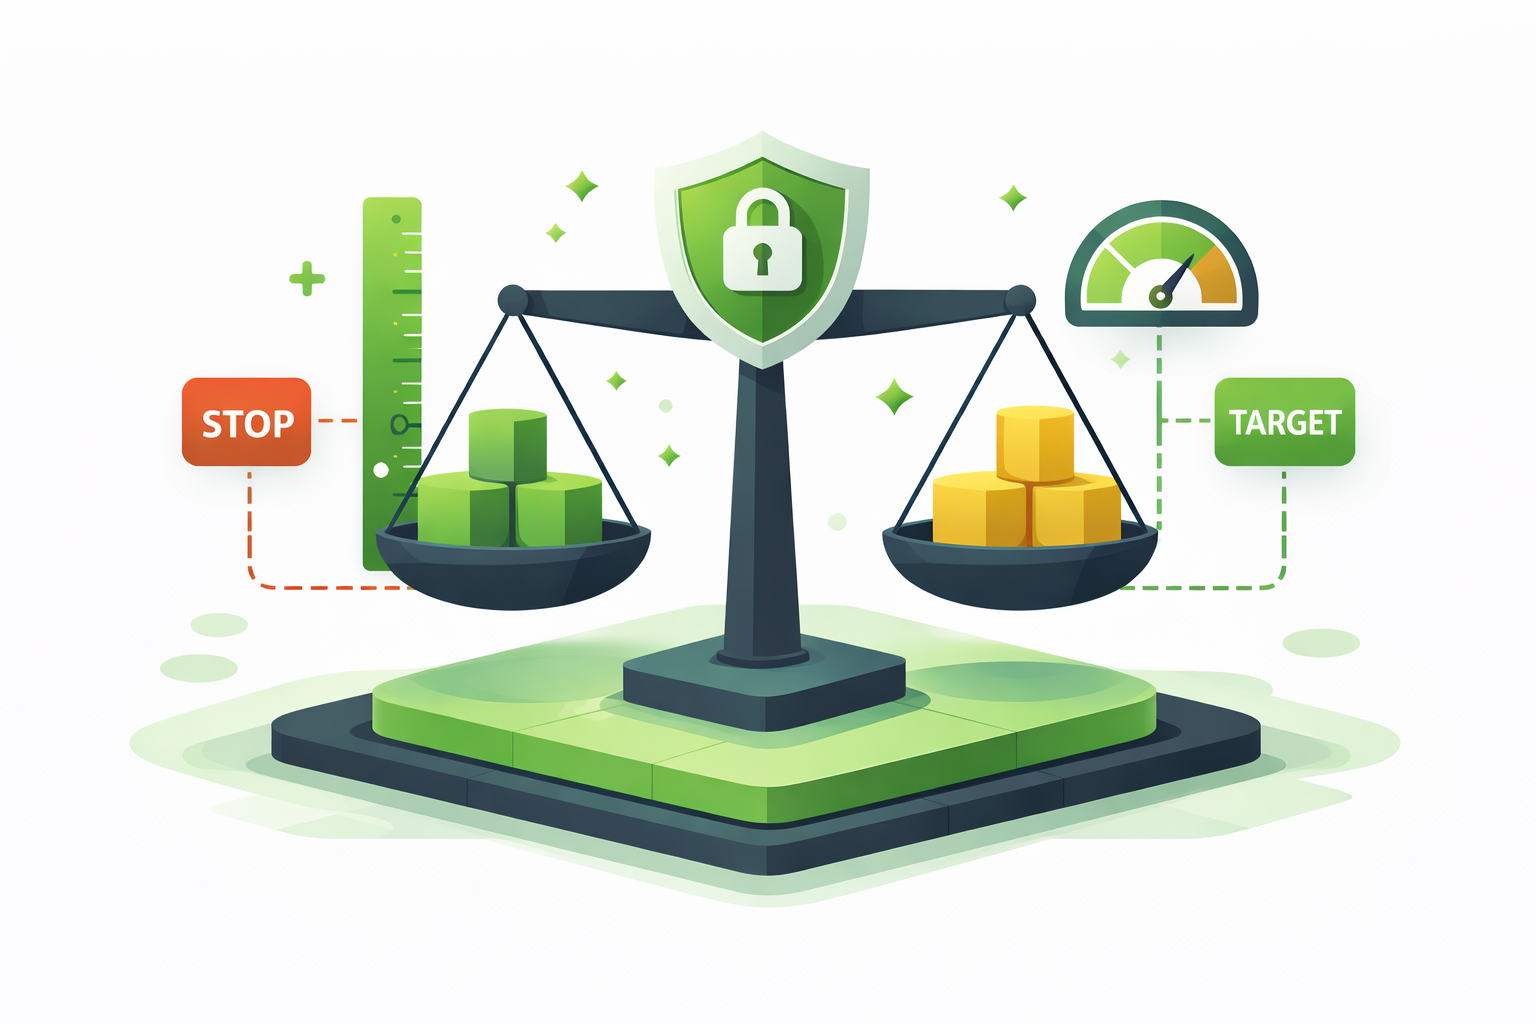
Most investors think about what they'll make if they're right. Smart investors think about what they'll lose if they're wrong. Risk management tools help you control downside, size positions properly, and avoid catastrophic losses that wipe out years of gains.
TL;DR
- Position size determines survival: Even great ideas fail sometimes, proper sizing keeps losses manageable
- Calculate before risking: Tools show how much to allocate so no single mistake destroys your portfolio
- Track exposure in real time: Know your total risk across all positions, strategies, and correlations
- Set stops and limits: Automated tools enforce discipline when emotions say "hold on, it'll come back"
- Stress test scenarios: See what happens to your portfolio if your largest position drops 50% or the market falls 30%
Why Risk Management Tools Matter for Value Investors
Value investing with options amplifies both opportunities and risks. Selling covered calls caps upside, selling cash-secured puts commits capital that might get trapped in declining stocks, buying LEAPS introduces leverage and time decay. Without tools to manage these risks, you're flying blind.
Position sizing is the most important risk control. If you put 40% of your portfolio into one stock and it drops 60%, you just lost 24% of your total capital from a single mistake. Tools help you size positions so no single trade, even a complete failure, derails your long-term plan.
Risk management isn't about avoiding losses, it's about controlling them. You're going to be wrong sometimes. The goal is to be wrong small and right big, which requires measuring and limiting exposure systematically.
What Good Risk Management Tools Do
The basics: they calculate position sizes based on rules you define. If your rule is "no position larger than 8% of portfolio," the tool tells you how many shares to buy given your current portfolio value and the stock price. Simple math, but easy to mess up when you're excited about a trade.
Better tools handle options exposure correctly. They know that selling a covered call on 100 shares of a $50 stock represents $5,000 of exposure, not just the premium collected. They track how much capital you've committed to cash-secured puts, showing total capital at risk across all strategies.
The best tools run scenario analysis. They show what happens to your portfolio if: the S&P 500 drops 20%, your largest position drops 50%, volatility spikes to 40%, or interest rates rise 2%. You see your worst-case exposure before it happens, giving you time to hedge or reduce positions.
Position Sizing Calculators
Free online calculators let you input account size, risk per trade (typically 1-2%), and stop loss level. They output how many shares to buy so if the stop hits, you lose exactly your target amount. Simple and effective for stock-only portfolios.
More sophisticated calculators account for correlations. If you own five tech stocks, losing 2% on each isn't five independent losses, it's 10% lost on correlated positions that tend to move together. Tools that adjust for correlation give you true portfolio risk, not just individual position risk.
The Wall St Yardie app includes position sizing for options strategies, showing how much capital to commit to each cash-secured put or covered call based on portfolio size and risk tolerance. It factors in margin requirements and assignment risk so you don't accidentally overcommit capital.
Portfolio Risk Dashboards
Interactive Brokers, Thinkorswim, and Tastytrade all offer risk dashboards showing your portfolio's sensitivity to price changes, volatility shifts, and time decay. Greeks aggregated across all positions reveal your true exposure: if your portfolio delta is 5,000, you're long the equivalent of 50 shares of the underlying index.
These tools show "what if" scenarios instantly. You type "SPY drops 10%" and see how your portfolio value changes. This makes abstract risk concrete. You're not guessing how bad a correction would hurt, you're seeing the number right now.
The downside: broker dashboards only show risk at that broker. If you have positions at multiple brokers, you need to aggregate manually or use third-party tools that pull data from multiple sources.
Stop Loss and Limit Order Tools
Manual stop losses work until you're traveling, sick, or just forget to monitor positions. Automated stop loss tools execute immediately when a stock hits your threshold, removing emotion from the decision.
Trailing stops adjust upward as a stock rises, locking in gains while still allowing for upside. If you buy at $40 with a 15% trailing stop, it triggers at $34. If the stock rises to $50, the stop moves to $42.50. You capture most of the upside while protecting against sudden reversals.
The risk: stops get hit by short-term noise, selling you out before a recovery. Value investors hate this because temporary drawdowns are part of owning wonderful companies trading below intrinsic value. Use stops selectively, maybe on speculative positions but not on core holdings.
Correlation and Concentration Tracking
You own Apple, Microsoft, Nvidia, Amazon, and Google. You think you're diversified across five stocks. Correlation tools reveal they all move together 80% of the time because they're all mega-cap tech. Your "diversification" is an illusion.
Tools that track sector, industry, and factor exposure show hidden concentrations. Maybe 60% of your portfolio is growth stocks even though you think you're a value investor. Or 40% of your exposure is to companies with high debt loads, which all struggle when rates rise.
Once you see concentrations, you can fix them. Rebalance into different sectors, add defensive positions, or buy protective puts on correlated holdings. The first step is seeing the problem, tools make it visible.
Stress Testing and Scenario Analysis
Stress tests show how your portfolio performs under specific conditions: 2008-style financial crisis, 2020-style pandemic shock, or 1970s-style stagflation. You see max drawdowns, recovery times, and which positions hurt most.
Good tools let you build custom scenarios. "What if my three largest positions each drop 40%?" or "What if volatility doubles and stays high for six months?" These aren't predictions, they're preparations. When the scenario happens for real, you already know the answer because you ran the numbers.
Some investors stress test monthly, adjusting positions if worst-case losses exceed their tolerance. Others stress test before adding leverage or concentrated bets, confirming they can survive even if they're wrong. Both approaches beat ignoring risk until it materializes.
Margin and Leverage Monitoring
LEAPS provide leverage without margin debt, but they still amplify losses if you're wrong. Tools that calculate total leverage (stock positions + options delta + borrowed funds) show your true exposure. If your delta is 150% of your account value, you're leveraged 1.5x, and 10% market moves become 15% portfolio moves.
Brokers display margin usage and maintenance requirements, but they don't tell you if you're using leverage wisely. Risk management tools ask better questions: Is this leverage applied to high-conviction ideas? Do you have cash reserves to handle margin calls? What happens if positions move against you?
Leverage amplifies mistakes as much as successes. Monitoring tools keep leverage in check, preventing situations where a normal market correction forces liquidations.
Building a Personal Risk Framework
Tools are useless without rules. Start by defining your risk tolerance:
- Maximum loss per position (commonly 1-2% of portfolio)
- Maximum total portfolio at risk (commonly 15-20% across all positions)
- Maximum position size (commonly 5-10% per stock)
- Maximum leverage (commonly 1.0x to 1.3x)
Enter these rules into your tools and let them enforce discipline. When a tool says "this trade violates your 8% position size limit," you have three choices: reduce the position, revise your rule (with good reason), or skip the trade. At least you're making a conscious decision instead of drifting into excessive risk.
Review your rules annually. If your risk tolerance changes (more wealth, different time horizon, new goals), update your framework. The rules should match your reality, not generic advice from books.
Automating Risk Controls
Set alerts that notify you when:
- Any position exceeds 12% of portfolio (allocation drift)
- Total capital committed to options exceeds 30% (overextension)
- Portfolio beta exceeds 1.2 (too much market risk)
- Cash reserves drop below 10% (no dry powder for opportunities)
Automation removes the need for constant monitoring. You check alerts weekly, address issues when they arise, and otherwise trust your system. This frees mental energy for higher-value work like researching wonderful companies.
Some investors resist automation, believing they'll remember to check everything manually. They won't. Humans are terrible at consistent repetitive tasks. Tools don't forget, don't get distracted, and don't rationalize away risks they don't want to see.
Integrating Risk Management Across Strategies
If you're running covered calls, cash-secured puts, and protective puts across multiple stocks, your total exposure is complex. Tools aggregate risk across strategies, showing:
- Capital committed to selling puts (waiting to be assigned)
- Upside capped by covered calls (opportunity cost quantified)
- Downside protected by protective puts (insurance cost vs benefit)
This holistic view prevents surprises. You realize you've committed 70% of your cash to put-selling, leaving no reserves if you get assigned on everything at once. Or you see that selling calls too aggressively across your portfolio caps upside to 8% annually even if stocks double. Risk management tools reveal these trade-offs explicitly.
What Could Go Wrong?
Over-reliance on tools: Risk management formulas assume normal market behavior. During panics, correlations go to 1.0 (everything drops together) and liquidity vanishes. Tools can't predict these events, they just measure exposure under normal conditions. Keep cash reserves beyond what tools recommend because real disasters break the models.
False precision: A tool saying "your portfolio has a 98% probability of not losing more than 15% this year" sounds scientific. It's not. It's based on historical data and assumptions that might not hold. Treat outputs as estimates, not guarantees. Real risk is unknowable, you're just trying to be less ignorant than average.
Paralysis from over-analysis: Some investors run so many scenarios they never trade. "What if rates rise AND recession hits AND my largest position falls 60%?" Eventually you imagine scenarios so unlikely they're not worth hedging. Risk management helps you act confidently, not avoid acting entirely.
Ignoring the biggest risk: Tools can't measure every risk. Regulatory changes, fraud, technological disruption, and management incompetence don't show up in position size calculators. Focus on business quality first. All the risk tools in the world won't save you from owning terrible companies.
Next Steps
- Define your rules: Write down maximum position size, portfolio risk tolerance, and leverage limits before using any tools, rules come first, tools enforce them
- Start with basics: Use a position sizing calculator for your next trade to see how much you should buy based on stop loss and risk tolerance
- Set one alert: Pick your most important risk control (e.g., "notify me if any stock exceeds 10% of portfolio") and set it up today
- Stress test quarterly: Run a worst-case scenario every three months to confirm you can survive your biggest position dropping 50%
- Link to portfolio tracking: Risk management tools work best when paired with accurate portfolio tracking
Related reading:
- Risk Management with Options explains the value investor's philosophy on defense before offense
- Position Sizing Rules shows how to allocate capital systematically
- Managing Position Sizing with Options covers specific techniques for options exposure
*Disclaimer: This content is for educational purposes only and does not constitute financial advice. Past performance does not guarantee future results. Always conduct your own research before investing.*