
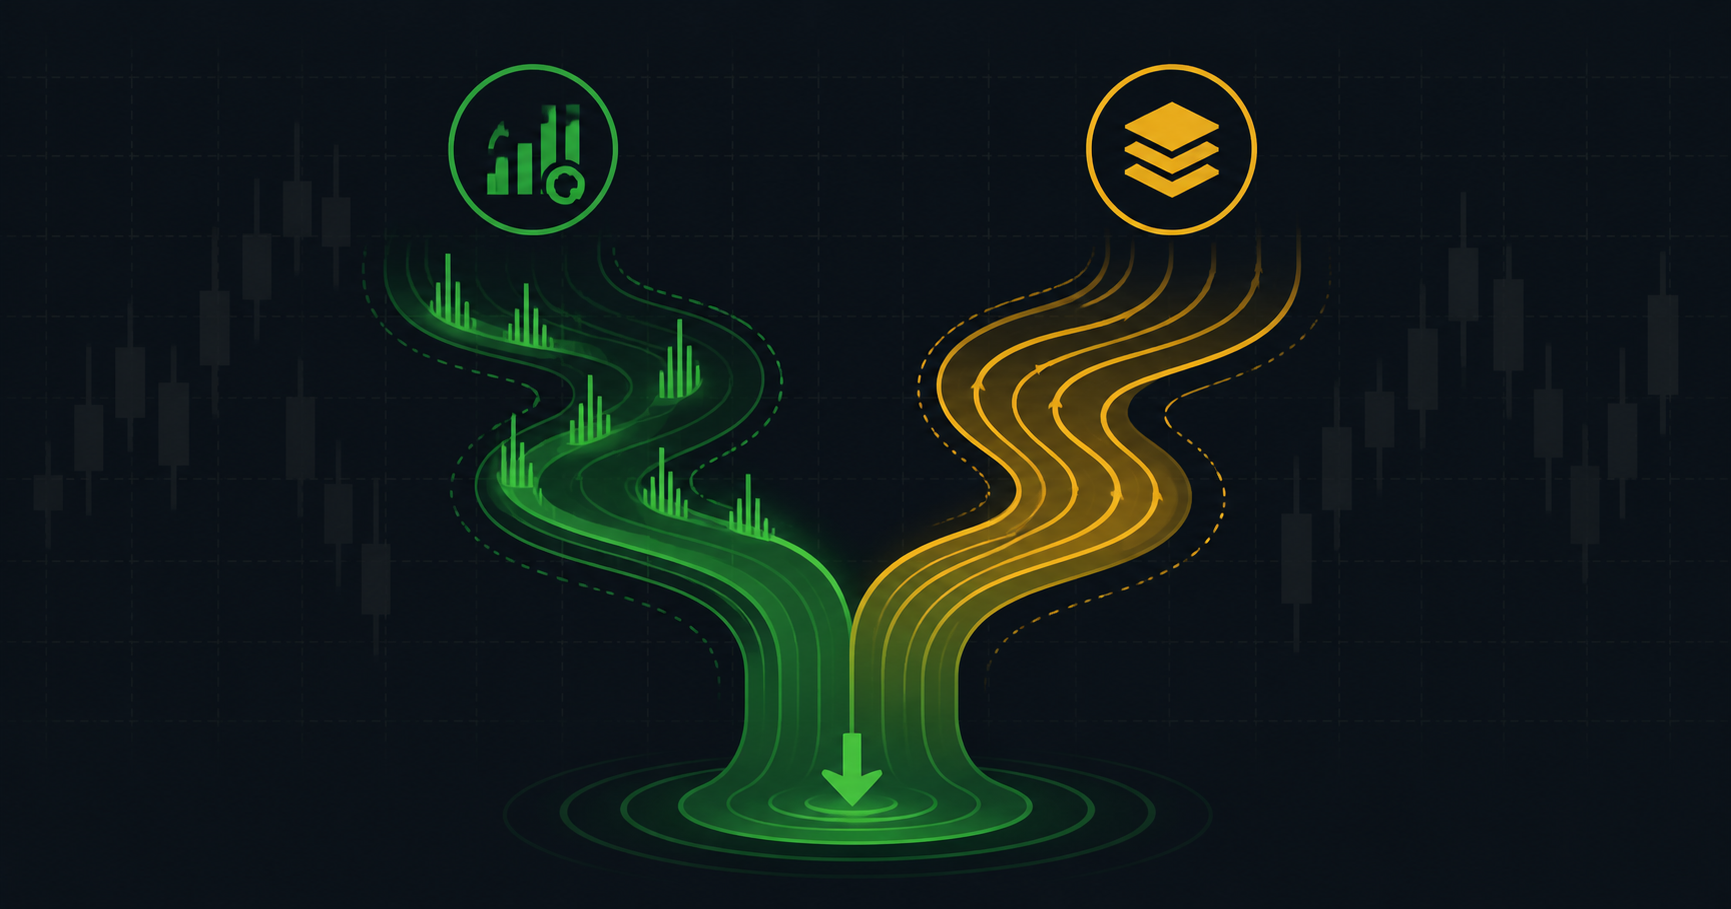
Open Interest vs Volume: Which Matters More for Options Liquidity?
Most beginner options investors learn to check volume. Fewer learn to check open interest. And almost none understand how the two signals interact to reveal the true health of an options market. If you want to trade options without getting caught in thin untradable markets with punishing spreads, you need both numbers, and you need to know how to read them together.
TL;DR
- Volume = contracts traded today: it resets every day (session) and tells you how active a specific option is right now
- Open interest = total open contracts: it accumulates over time and signals sustained market interest in a strike
- High volume, low open interest can be a trap: one-day spikes may reflect closing trades, not new participation
- High open interest, low volume can be equally misleading: old positions do not guarantee you can trade today at a fair price
- Aim for both: quality options have consistently high open interest and meaningful daily volume
Volume: The Pulse of the Market Today
Volume counts how many options contracts traded hands during a session (day). Every time a buyer and seller complete a transaction, volume goes up by one. At the end of the day, it resets to zero and starts fresh the next morning.
Volume tells you whether a specific contract is active right now. If a $50 call on a mid-cap company shows only 12 contracts traded today, that is a signal to pause. Low volume means few participants are engaging with that strike on that expiration. You may be able to get in, but getting out on your terms could be difficult.
High volume, on the other hand, means competition. Buyers and sellers are negotiating prices actively, which creates tight bid-ask spreads and the ability to enter and exit efficiently.
Practical rule of thumb: Look for at least 100 contracts of volume per day on any option you are considering. For income strategies like covered calls and cash-secured puts, you often want 200 to 500 or more to ensure smooth execution.
Open Interest: The Market's Memory
Open interest measures the total number of contracts that are currently open and have not yet been closed, exercised, or expired. When you open a new position, open interest increases. When you close it or it expires, open interest decreases.
Think of open interest as the market's long-term commitment to a specific strike and expiration. If a $55 call has 4,000 open contracts, that means 4,000 contracts worth of traders have ongoing positions there. They expect the stock price to interact with that strike at some point before expiration.
High open interest also acts as market depth. If you need to trade 10 contracts, a market with 4,000 open interest can absorb your order easily. A market with 40 open interest cannot, and you may move the price just by showing up.
Open interest signals market confidence. Strikes with massive open interest often become focal points for stock price movement near expiration. Traders, market makers, and institutions are all watching those levels.
How They Work Together
Neither number alone tells the complete story. The real insight comes from reading them together.
High volume + high open interest: This is the sweet spot. Traders are active today and have been consistently engaged over time. Spreads will be tight and execution will be smooth. Prioritize these contracts when selecting strikes.
High volume + low open interest: Proceed with caution. A sudden spike in volume with little open interest usually means traders are closing old positions or reacting to a news event. The activity may not persist tomorrow. Before entering, check whether the volume represents new buying or old positions being unwound.
Low volume + high open interest: This contract has many open positions but is quiet today. Spreads may be wide because few traders are actively quoting prices in the current session. You can still trade here, but use limit orders and be patient. The underlying interest is real, it is just sleeping today.
Low volume + low open interest: Avoid unless you have an unusual reason. Few participants, no sustained interest, and wide spreads make this a poor trading environment. Even if the strike looks ideal for your strategy, execution costs will eat your returns.
A Numeric Example
You are looking at two call options on the same stock, both at $50 strike expiring in 35 days:
Option A:
- Open interest: 2,800 contracts
- Volume: 340 contracts today
- Bid: $2.48, Ask: $2.52
- Spread: $0.04 (1.6%)
Option B:
- Open interest: 65 contracts
- Volume: 8 contracts today
- Bid: $2.20, Ask: $2.80
- Spread: $0.60 (22.2%)
Both options are at the same strike and same expiration on the same stock. Option A is liquid, with a tight spread and active participation. Option B is a trap. If you sell Option B as a covered call and the stock moves against you, exiting that position will cost you $60 per contract before the stock even moves. Over a year of monthly trades, that spread drag equals hundreds of dollars lost.
Option A costs $4 to enter and roughly $4 to exit. Option B costs $60 each way. The choice is clear.
Where to Find Volume and Open Interest Data
Every major broker displays open interest and volume on the options chain screen. They typically appear as columns alongside the strike price, bid, ask, and expiration date.
When you pull up an option chain:
- Look through open interest to find the most popular strikes
- Check the volume column to confirm today's participation
- Cross-reference with the bid-ask spread to ensure tightness
Some investors also look at put-call volume ratios and open interest ratios to gauge market sentiment. A rising put open interest compared to calls can signal growing caution among traders. A surge in call volume can reflect optimism or hedging. For pure liquidity purposes though, just focus on the raw numbers.
Applying This to Value Investing Strategies
When you use options as an income overlay on your value stock portfolio, liquidity affects every decision. Covered calls require you to sell contracts and potentially roll them forward each month. Each roll is a trade. If the option is illiquid, each roll costs more.
Cash-secured puts require buying back or rolling positions when a stock approaches your strike. Again, liquidity determines whether you can make that adjustment at a fair price or get penalized for poor market conditions.
The fix is straightforward: screen for value stocks where the options also have strong liquidity. A company that checks all your fundamental boxes but has thin options is not ideal for an options overlay strategy. Check intrinsic value with Wall St Yardie and confirm options liquidity in your broker's chain before committing capital.
What Could Go Wrong?
Misreading one-day volume spikes: Sometimes a news event or earnings surprise causes volume to spike dramatically for a single session. The next day, volume falls back to near zero. Do not let a one-day spike trick you into thinking an option is consistently liquid.
Mitigation: Look at average daily volume over the past week or two, not just today's figure. Many brokers display this as "average volume" alongside current volume.
Confusing open interest with activity: An option can have 3,000 open contracts from a year ago when the stock was at a different price. If the stock has moved far away from that strike, those contracts are deeply out of the money and few new traders are engaging. High open interest with no recent volume means a stale market.
Mitigation: Verify that current volume is at least 5 to 10% of open interest on any given day for the contract you plan to trade.
Entering without checking open interest on less-popular expirations: Weekly options on individual stocks often have low open interest even when monthly cycles are liquid. What looks like a great strategy using a weekly expiration can fall apart at execution because the market for that specific week is thin.
Mitigation: Default to monthly expirations. If you use weeklies, check open interest before assuming the liquidity of the monthly carries over.
Next Steps
- Before any trade, check both volume and open interest on your broker's option chain
- Set a personal minimum: at least 100 contracts of open interest and 50 daily volume for any contract you trade
- Compare options across nearby strikes to find where liquidity concentrates
- Review your existing positions to confirm that open interest has not dropped dramatically since you entered
- Prefer monthly expirations where open interest and volume are consistently higher than weeklies
- Read about bid-ask spreads alongside these signals for a full liquidity picture before executing any trade
Open interest and volume are the heartbeat and memory of the options market. Volume tells you the market is alive today. Open interest tells you traders have conviction over time. Used together, they will steer you away from thin, expensive markets and toward the liquid ones where your value investing strategies can work the way they are supposed to.
*Disclaimer: This content is for educational purposes only and does not constitute financial advice. Past performance does not guarantee future results. Always conduct your own research before investing.*